Facts
Travel
Hotels
Restaurants
Business
Photos
|
Brasilia - Satellite cities
See also:
 Brasília Brasília
Brasília Maps
Brasília Facts
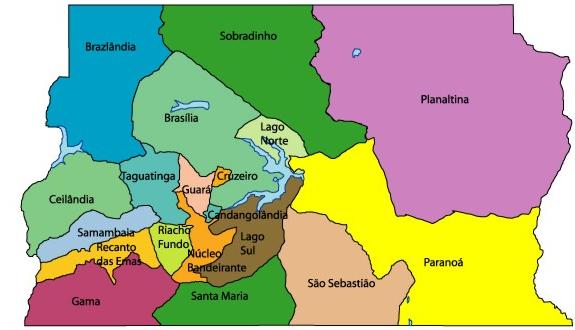
The map above shows the satellite cites (in Portuguese, "cidades satélites") of Brasilia.
What are the satellite cities?
During the construction of Brasilia, many migrants came from all over Brazil (particularly the poorer, populated States in Brazilian northeast). Problem: Brasilia was designed to be residence of dignitaries, authorities, civil servants and respective families; no room was planned for that horde of migrants.
It was assumed that those migrants would return home after Brasilia was finished. They did not. Most of them came from poor cities, and they were seeing a good oportunity to have a better life in the new capital. They couldn't afford a place in the select Pilot Plan. They started to create provisional communities in the neighbourhood of the Pilot Plan (like satellites).
These communities grew (much quicker than the planned Brasilia), were recognized by the public power and became what today is called Satellite Cities.
Are satellite cities really cities?
No. The Federal District can't be divided in cities (read here).
In Brazil, a city (or, more precisely, a municipality) is a member of the Federation, with independent Executive (mayors) and Legislative (councilmen) Powers.
The Federal District is divided in Administrative Regions. Each satellite city is an Administrative Region. They are ruled by an Regional Administrator, appointed by the Governor of the Federal District. Likewise, laws of the Administrative Regions are voted by the Legislative Assembly of the Federal District.
What are the Administrative Regions of the Federal District?
|
Administrative Regions |
Total Area (km²) |
Population |
Density (hab/km²) |
|
RA 1 Brasília |
472,12 (8,1%) |
198.422 (9,6%) |
420 |
|
RA 2 Gama |
276,34 (4,7%) |
130.580 (6,3%) |
472,5 |
|
RA 3 Taguatinga |
121,55 (2%) |
243.575 (11,8%) |
2.003,9 |
|
RA 4 Brazlândia |
474,83 (8,2%) |
52.698 (2,5%) |
110,9 |
|
RA 5 Sobradinho |
572,59 (9,8%) |
128.789 (6,2%) |
224,9 |
|
RA 6 Planaltina |
1.534,69 (26,5%) |
147.114 (7,1%) |
95,8 |
|
RA 7 Paranoá |
853,33 (14,7%) |
54.902 (2,6%) |
64,3 |
|
RA 8 Núcleo Bandeirante |
80,43 (1,3%) |
36.472 (1,7%) |
453,4 |
|
RA 9 Ceilândia |
230,33 (3,9%) |
344.039 (16,7%) |
1.493,6 |
|
RA 10 Guará |
45,46 (0,7%) |
115.385 (5,6%) |
2.538,1 |
|
RA 11 Cruzeiro |
8,9 (0,15%) |
63.883 (3,1%) |
7.177,8 |
|
RA 12 Samambaia |
105,7 (1,8%) |
164.319 (8,0%) |
1.554,5 |
|
RA 13 Santa Maria |
215,86 (3,7%) |
98.679 (4,8%) |
457,1 |
|
RA 14 São Sebastião |
383,71 (6,6%) |
64.322 (3,1%) |
167,6 |
|
RA 15 Recanto das Emas |
101,22 (1,7%) |
93.287 (4,5%) |
921,6 |
|
RA 16 Lago Sul |
183,39 (3,1%) |
28.137 (1,3%) |
153,4 |
|
RA 17 Riacho Fundo |
56,02 (0,9%) |
41.404 (2,0%) |
739 |
|
RA 18 Lago Norte |
66,08 (1,1%) |
29.505 (1,4%) |
446,5 |
|
RA 19 Candangolândia |
6,61 (0,1%) |
15.634 (0,7%) |
2.365,2 |
|
Distrito Federal |
5.789,16 (100%) |
2.051.146 (100%) |
354,3 |
Sources:
- Companhia Energética de Brasília - CEB
- Conselho Nacional de Política Fazendária - CONFAZ
- Instituto Brasileiro de Geografia e Estatística - IBGE
- Secretaría de Estado de Desenvolvimento Urbano e Habitação - SEDUH / GDF
|
|